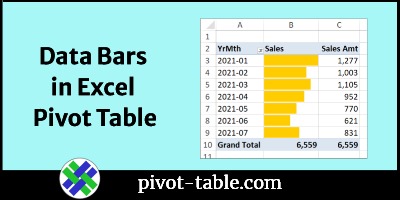
Most pivot tables show numbers, so you can see a detailed summary of the source data. To add a visual element to the pivot table, add data bars that are similar to a bar chart. This works well in a simple pivot table, with only one or two columns of data.
Continue reading “Show Sales Amounts as Data Bars in Excel Pivot Table”