Quick Count Unique (Distinct) Items in Excel Pivot Table

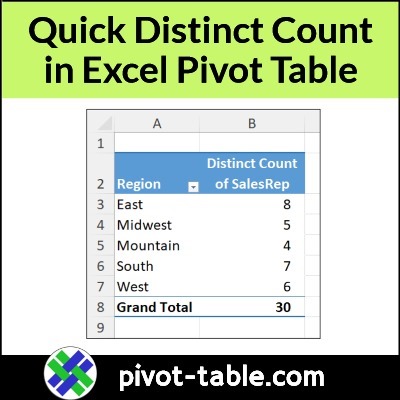
It’s easy to get a sum in a pivot table, or a total count. But how can you count unique items in an Excel pivot table?

For example, if you’re analyzing sales data, you might need to show these types of counts:

–How many unique products were sold in each store?
–How many distinct people made sales in each region?

Continue reading “Quick Count Unique (Distinct) Items in Excel Pivot Table”

Pivot Table Calculated Field Counting Problem

A pivot table calculated field always uses the SUM of other values, even if those values are displayed with another summary function, such as COUNT. That can cause results that look wrong, but the video below shows a workaround to fix the problem.

Continue reading “Pivot Table Calculated Field Counting Problem”

Excel GetPivotData Formula Love It or Turn It Off

Do you love the Excel GetPivotData formula, that appears automatically, when you click on a pivot table value? Or do you want to know how to turn that annoying setting off? In the two videos below, see how to turn GetPivotData off or on, and see an enhanced formula, that pulls data from a specific pivot table in your workbook.

Continue reading “Excel GetPivotData Formula Love It or Turn It Off”

Excel Pivot Table Custom Subtotal Limitations

In an Excel pivot table, subtotals are automatically added to the outer fields, when you add more fields below them. You can also add extra subtotals, if needed, by creating custom subtotals for a pivot field. There are some limitations though, which you can see in the video and notes below. Continue reading “Excel Pivot Table Custom Subtotal Limitations”

Check Sales Progress with Percent Running Total in Excel Pivot Table

Quickly check your sales results over time, or by top products, with the % Running Total feature in an Excel pivot table. This feature is available in Excel 2010, and later versions.

Continue reading “Check Sales Progress with Percent Running Total in Excel Pivot Table”

Excel Pivot Table Values Problems with Average Function

When you add a value to an Excel pivot table, it automatically summarizes the values by Sum or Count. Later, you can change the setting, to use a different summary function. In this example, you’ll see how to use the Average function. You might see errors, and there are differences between a normal pivot table, and a pivot table where data was added to the Data Model.

Continue reading “Excel Pivot Table Values Problems with Average Function”

Show Difference in Values in Excel Pivot Table

You don’t need fancy formulas in a pivot table, if you want to show the difference between values. Use this built-in feature instead! With a couple of clicks, you’ll see the difference between sales in East and West regions. Or, see the percent difference in sales for this month and last month.

Continue reading “Show Difference in Values in Excel Pivot Table”

How to Use Different Number Format in Excel Pivot Chart

When you create a new pivot chart in Excel, its number formatting is copied from the pivot table that it’s based on. See how to change the pivot chart number formatting, without affecting the pivot table’s number formatting. If you have several pivot charts to change, use a macro to make the job easier.

Continue reading “How to Use Different Number Format in Excel Pivot Chart”