When you add a value to an Excel pivot table, it automatically summarizes the values by Sum or Count. Later, you can change the setting, to use a different summary function. In this example, you’ll see how to use the Average function. You might see errors, and there are differences between a normal pivot table, and a pivot table where data was added to the Data Model.
Sample Data for Pivot Tables
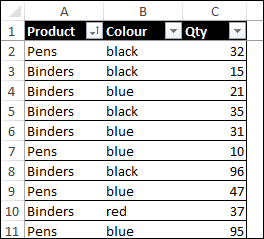
To show how the Average summary function works, the source data for the pivot tables is a small table with stationery supply orders.
- The table is named tblSupplies
- There are 3 columns in the table – Product, Colour, Qty
- There are 30 rows of data in the table.
Two pivot tables are created from this source data:
- Normal pivot table
- OLAP-based pivot table – its data was added to the Data Model
Normal Pivot Table
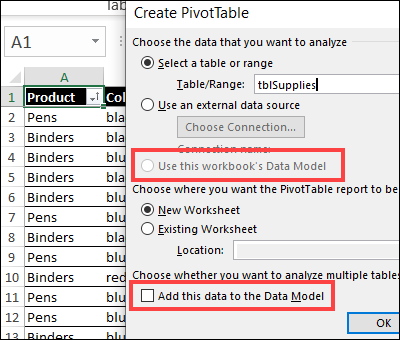
To create a normal pivot table from the source data, here are the steps:
- Select a cell in the table
- On the Ribbon’s Insert tab, click the top part of the Pivot Table button
- In the Create Pivot Table dialog box, tblSupplies should be automatically selected
- For the location, choose New Worksheet
- Do NOT choose either of the Data Model settings
- Click OK
Add Fields to Pivot Table
Next, add the fields to the pivot table layout
- In the PivotTable Fields list, check Product, to add it to the Rows area
- Drag Colour to the Values area
- Check Qty, to add it to the Values area
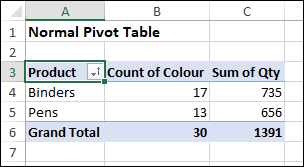
In the Values area, the default summary functions were automatically applied:
- Colour has the Count function, because it is a text field
- Qty has the Sum function, because it is a numeric field
Create an OLAP-Based Pivot Table
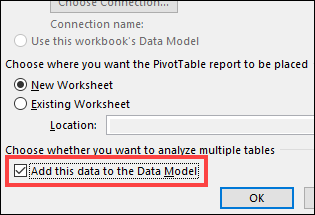
Next, to create an OLAP-based pivot table, follow the same steps, but DO check the box for “Add this data to the Data Model”
Add the fields to the same areas as the normal pivot table, and the OLAP-based pivot table should look the same as the normal pivot table.
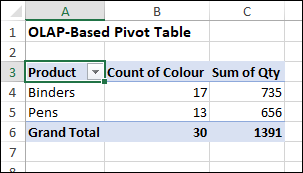
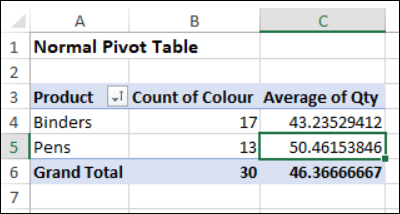
Normal Pivot Table Average Qty
Next, instead of showing the Sum for the Qty field, follow these steps to change the summary function to Average
- Right-click one of the numbers in the Qty field
- Point to Summarize Values By
- Click on the Average function
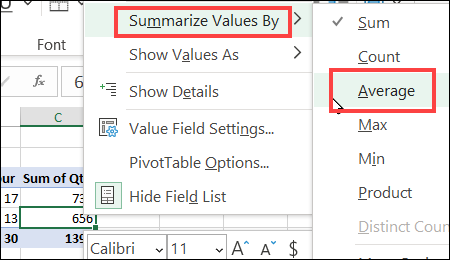
The heading for the Qty field changes to Average of Qty, and the numbers change, to show the average quantity for each product.
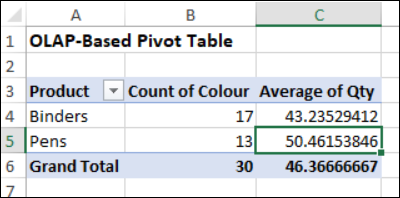
OLAP-Based Pivot Table Average Qty
Next, follow the same steps in the OLAP-based pivot table, to change the summary function to Average, for the Qty field.
The result will look exactly the same as the normal pivot table.
Normal Pivot Table Average Colour
Next, you’ll see the differences between the pivot tables, when working with a text field (Colour) instead of a numeric field (Qty).
First, in the normal pivot table, follow these steps:
-
- Right-click one of the numbers in the Colour field
- Point to Summarize Values By
- Click on the Average function
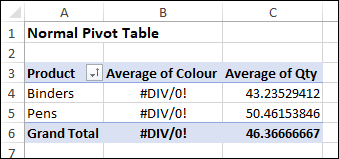
The heading changes to Average of Colour, and row shows a Divide by Zero error, #DIV/0!, because:
- Average is the sum of the numbers, divided by the count of the numbers
- There are zero numbers in the Colour data
OLAP-Based Pivot Table Average Colour
Next, in the OLAP-based pivot table, try to make the same change to the Colour field’s summary function.
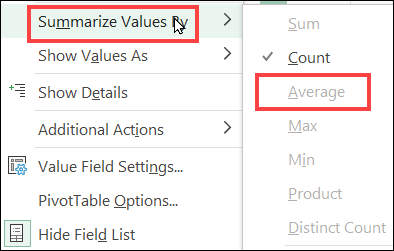
- In the list of summary functions, Count is the only function available
- You can’t select Average, or any of the other functions in the list
- You’ll have to leave the Colour field as it is, showing the Count
Summary Function Differences
Here’s a quick summary of the difference in summary functions, for the two types of pivot tables.
Numeric Fields
- Normal – choose any of the summary functions – Distinct Count not in list
- OLAP-based – choose any of the summary functions, including Distinct Count
Text Fields
- Normal – choose any of the summary functions listed
- OLAP-based – only Count is available
Video: Distinct Count OLAP-Based Pivot Table
This short video show the steps for showing a distinct count in an OLAP-based pivot table. This is the summary function I mentioned above, that is not available for normal pivot tables.
There’s more information on the Count Unique Items in Pivot Table page on my Contextures site.
Get the Excel File
To get the sample file for Summarize Values By Average, go to the Pivot Table Summary Functions page on my Contextures site.
In the Download section, get workbook #3 – Distinct Count. It has the same data for Stationery Supplies. The zipped file is in xlsx format, and does not contain any macros.
____________________
Excel Pivot Table Values Problems with Average Function

____________________
