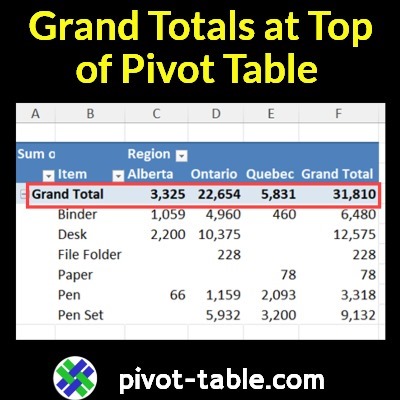
There’s no setting that lets you show the grand totals at the top of an Excel pivot table. But watch my short video below, to see a quick trick, to get around that limitation!
Continue reading “Video: Show Excel Pivot Table Grand Totals at Top”
by contextures.com
There’s no setting that lets you show the grand totals at the top of an Excel pivot table. But watch my short video below, to see a quick trick, to get around that limitation!
Continue reading “Video: Show Excel Pivot Table Grand Totals at Top”
Do you love Excel pivot tables? And have you tried Excel’s new PIVOTBY function?
With just one formula cell, PIVOTBY can summarize annual sales by year, region, and category!
But is PIVOTBY better than Excel pivot tables?
Continue reading “Is Excel PIVOTBY Function Better Than Pivot Tables?”
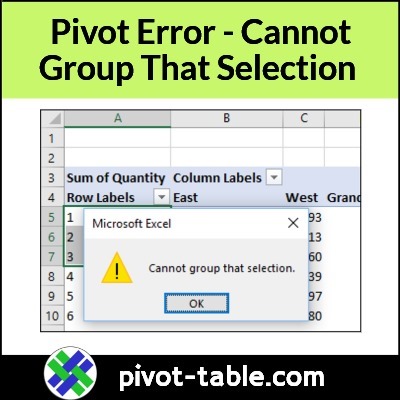
In an Excel pivot table, if you try to group a date or number field, you might see an error message. The message box shows a yellow warning label, and the text says, “Cannot group that selection”.

Continue reading “Fix Pivot Table Problem – Cannot Group That Selection”
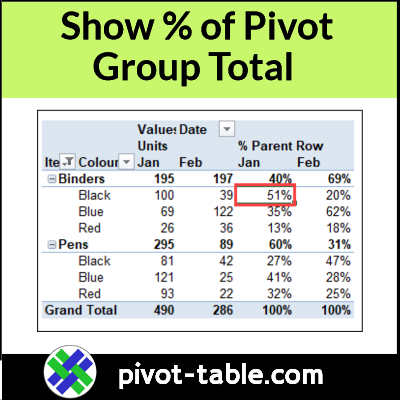
In an Excel pivot table, you can use Excel’s built-in custom calculations, for a different view of the data.
For example, in the video below, I set up a pivot table to show what % of a company’s monthly sales were Binders. Also, what % of Binder sales was for each colour – red, blue, and black.
Note: You can get the sample Excel file that I used for this video on the Pivot Table Show Values As page, on my Contextures site.
In the screen shot below, the pivot table has 4 fields in the worksheet layout:

Following the steps listed in the section below, I used pivot table custom calculations, to show additional sales details:
In the pivot table screen shot below, I’ve added a 2nd copy of the Units field to the values area.
For the 2nd copy of the Units field, I followed the steps below, to change that field’s calculation settings
In the pivot table, the second Units field changed, to show:
For example,

For more Pivot Table Subtotal tips, videos and examples, visit the following links:
Show Percent of Subtotal in Pivot Table
Pivot Table Show Values As % of Parent Total
Show Percent Of Subtotal In Pivot Table
______________________
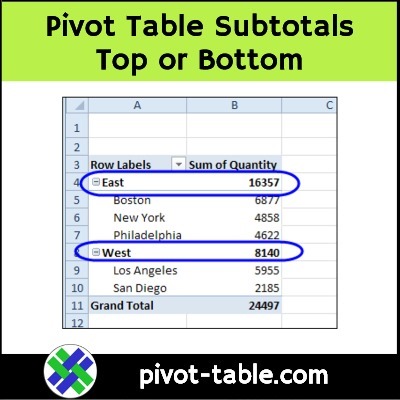
When you create a new pivot table, and add multiple fields to the row or column area, subtotals are automatically created. For Row fields the automatic subtotals usually appear at the top, and you can move them to the bottom, if that’s your preference. There are a few limitations though, which you can see in the video and the written notes below.
Continue reading “Show Excel Pivot Table Subtotals Top or Bottom”
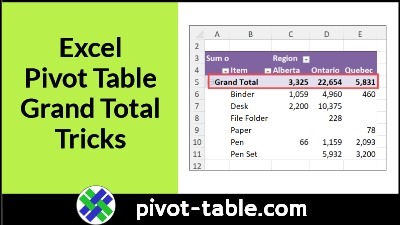
Excel automatically adds grand totals to a pivot table, if there are multiple items in the row area, or in the column area. See how you can change the automatic grand total headings (sometimes), and quickly remove grand totals if you don’t need them.
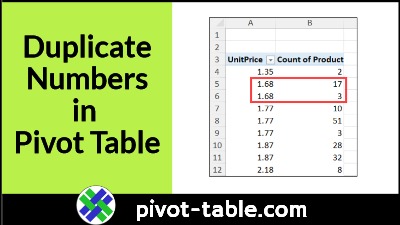
When you set up a pivot table, and put fields into the Rows Area or Columns area, Excel groups the items, and calculates the totals for each group. For example, see count of products for each Unit Price. Each item should only be listed once in the pivot table, but sometimes you might see duplicates.
Continue reading “Duplicate Numbers in Pivot Table Items Problem”
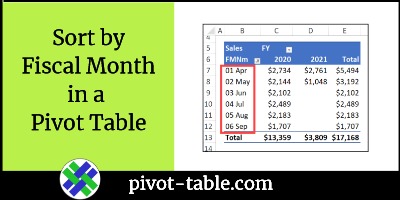
Does your business have a fiscal year that starts in a month other than January? In a pivot table, there’s no built-in way to group or sort the dates by their fiscal month number. See how to calculate those numbers in the source data, and then sort the data by fiscal month in a pivot table, with the month name included. Continue reading “Sort by Fiscal Month in a Pivot Table”
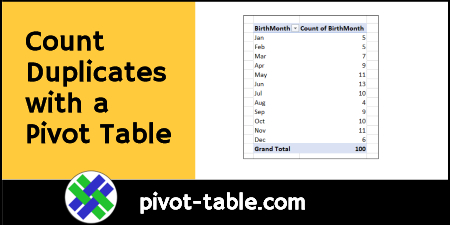
Excel is a great tool for working with a list of data, and calculating sums and counts. Use functions like COUNTIF and COUNTIFS, to get counts based on one or more criteria. But don’t forget about pivot tables, when you need a quick count or sum. With a few clicks, a pivot table will quickly show how many of each item are in a list.
Continue reading “Quickly Count Duplicates with Excel Pivot Table”
When you try to group dates in an Excel pivot table, or other pivot table items, you might get a pivot table error, “Cannot group that selection.” In Excel 2010, and earlier versions, that error was usually caused by blank cells in your source data, or text in the number or date columns. If you’re using Excel 2013 or later, there’s another reason that might prevent you from grouping pivot table items. Continue reading “Excel Pivot Table Error Cannot Group That Selection”