You don’t need fancy formulas in a pivot table, if you want to show the difference between values. Use this built-in feature instead! With a couple of clicks, you’ll see the difference between sales in East and West regions. Or, see the percent difference in sales for this month and last month.
Video: Difference From
This short video shows the steps to show the difference between values in a pivot table, and there are written steps below the video.
NOTE: The Show Values As settings are also called Custom Calculations.
There are more Show Difference examples and tips on my Contextures site.
Pivot Table Value Settings
When you make a new pivot table, the fields in the Values area will get these settings automatically:
- Summarize Values By – Sum or Count
- Show Values As – No Calculation
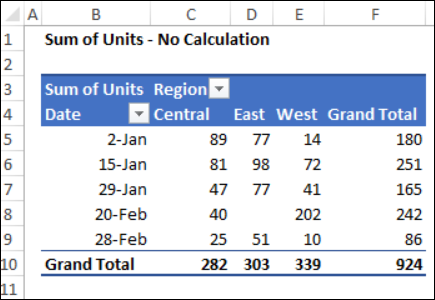
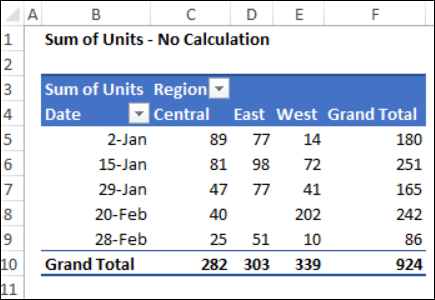
For example, in this pivot table, the Units field shows a “Sum of” for each region and date.
See the Value Settings
Here’s how you can see the pivot table value settings:
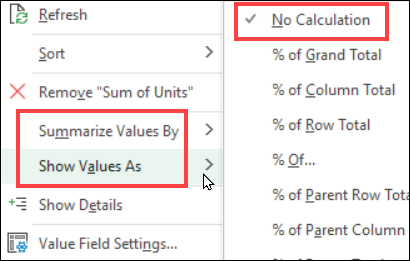
- Right-click a number in the Values area
- Point to Summarize Values By or Show Values As
- In the pop-up list, the current setting has a check mark
For a different view of your pivot table data, you can choose one of the other options, for either setting.
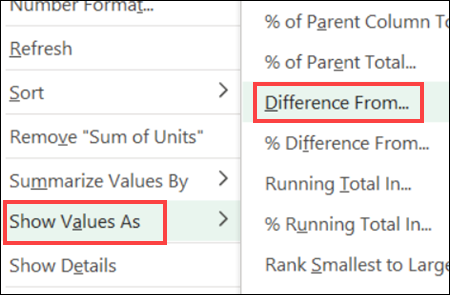
Difference From
For today’s example, we’ll look at the Show Values setting, and the Difference From option.
NOTE: To see all the settings for Show Values As, go to the Show Values As page on my Contextures site.
Choose the Base
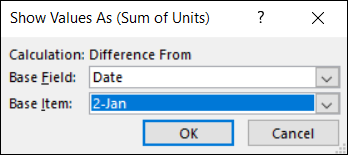
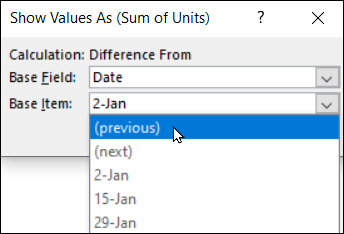
When you set up the Difference From calculations, you’ll select from two drop down lists:
- a Base Field — the pivot field in which you want to compare items
- a Base Item — the pivot item in that field, to use for comparison
For example, for sales data, you might use the Date field as the base. Then, compare all the other dates’ sales to the Jan 2nd sales.
Difference From Specific Date
Here is the original pivot table, with no calculation.
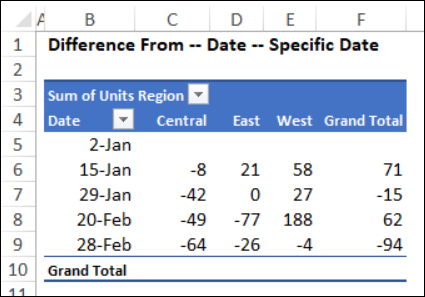
Here is the same pivot table, comparing each date’s sales to the Jan 2nd sales units.
NOTE: The Jan 2nd row is blank, because there’s zero difference — it’s the same data!
Difference From Previous Item
Another option for Show Difference setting is comparing each item to the previous item.
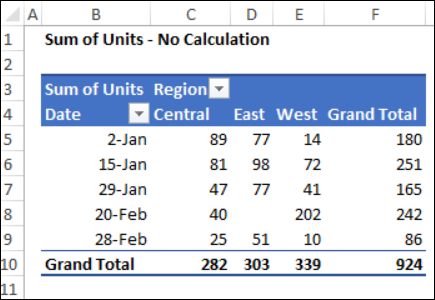
Again, here is the original pivot table, with no calculation.
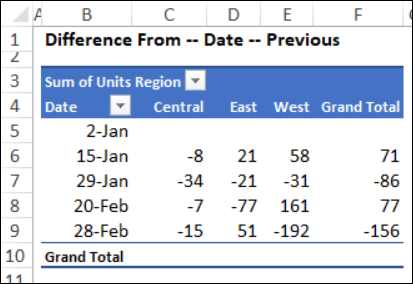
Here is the same pivot table, comparing each date’s sales to the previous date’s sales units.
NOTE: The Jan 2nd row is blank, because there’s no previous date with which to compare it.
Difference From Setup Tip
Here’s a tip if you’re going to use the Difference From setting:
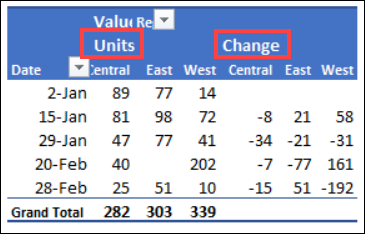
- Add a 2nd copy of the value field to the pivot table
- Use No Calculation in its Show Values As setting.
- Type new headings, to explain what’s in the columns
That makes it easy to see the original values, and the differences, at a single glance.
More Pivot Table Value Settings
For information on the other pivot table value settings, use these links on my Contextures site:
- There are more Show Difference examples and tips on my Contextures site.
- To see examples for the Summarize Values By settings, go to the Summary Functions page
- To see all the settings for Show Values As, go to the Show Values As page. These settings are also called Custom Calculations.
________________________
Show Difference in Values in Excel Pivot Table
________________________


