There are sample Excel files on my Contextures site, with data you can use for testing, or demos. The original sample file has sales data for a fictional office supply company. I’ve added more files recently, so see if they’ll be helpful to you too.
New Sample Data Files
Here’s a list of the new sample data files, and there are details below.
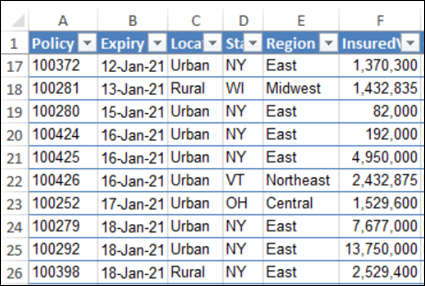
- Insurance Policies – 10 columns, 500 rows
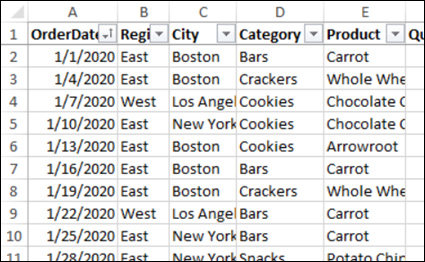
- Food Sales – 8 columns, 244 rows
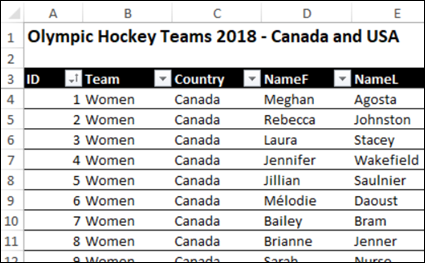
- Hockey Players – 15 columns, 96 rows
Insurance Policies
This sample has fictional commercial property insurance policy data. You can see a small section of
- There are 10 columns of data, with no calculations.
- There are 500 rows of data in the insurance policy table.
Food Sales
This sample has fictional food sales data.
- There are 8 columns of data, including 1 column with a calculation.
- There are 244 rows of data in the food sales table.
Hockey Data
This sample has data from the 2018 Olympic Hockey teams, from Canada and the USA.
- There are 15 columns of data, including 4 columns with calculations.
- There are 96 rows of data in the hockey player table.
I created pivot tables from this data, and wrote about it in a blog post on hockey player data analysis.
You can see some of my pivot tables below.
Hockey Player Pivot Tables
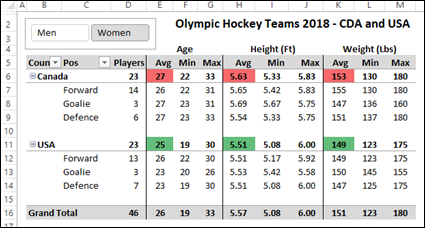
The first table shows player counts, for each position, plus age, height and weight.
- For each value, there are 3 different summary functions – Average, Minimum, and Maximum.
- In the country subtotal row, conditional formatting highlights the higher amounts in red, and lower amounts in green.
- A Slicer at the top left lets you see the data for Men or Women.
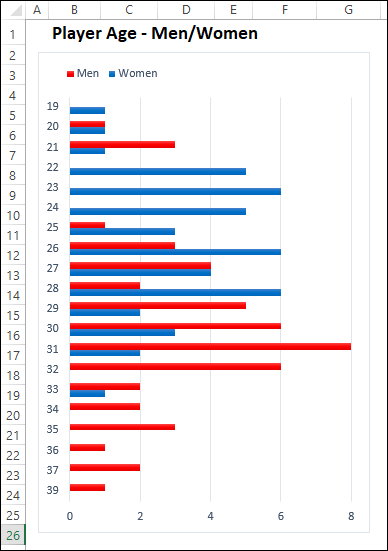
And this pivot chart shows the age ranges for the Men’s and Women’s players, from both countries.
The men have a substantially longer career, from what this shows.
Video: Filter All Pivot Charts
If you have several pivot charts on an Excel dashboard, and space is limited, here’s a way to change all pivot charts with a single filter cell. There are NO macros, just Slicers that are stored on a different sheet.
There are details in the Change All Pivot Charts with Single Cell Filter blog post.
Get the Sample Data Files
To get the Excel sample data files, go to the Sample Data page on my Contextures site.
If you’d like to see the hockey data file with the completed pivot tables, click this link to get my player data analysis workbook.
All of the zipped files are in xlsx format, and do not contain macros.
______________________________
Excel Sample Data for Pivot Table Testing
__________________________

