Do you create weekly or monthly reports based on pivot tables, and share those reports with clients or co-workers? If there are multiple pivot tables in your report, use this Excel dashboard technique to check all the filters, before you hit Send!
Dashboard Report Summary
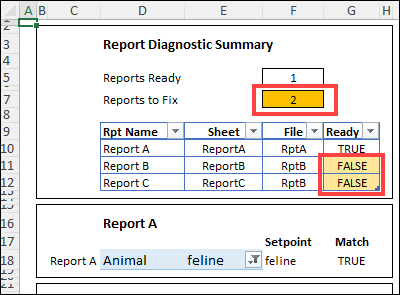
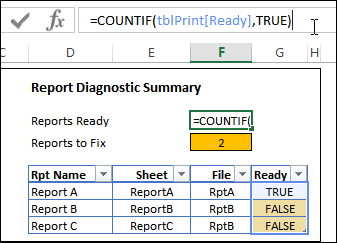
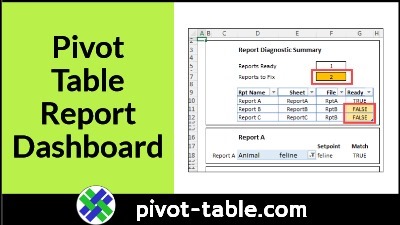
On this dashboard, you can quickly see how many of the pivot tables are ready for the monthly report. There’s also a count of how many pivot table need to be fixed before you can share them.
This workbook has three sheets with pivot tables – Report A, Report B, and Report C.
- Only one of those reports is ready for distribution
- The other two reports need to be fixed first
Having this summary dashboard could save you time – you won’t have to check each worksheet separately.
It could also save you from the embarrassment of sending out the wrong information to your clients or co-workers!
Thanks to AlexJ, who shared this technique for setting up a report monitoring sheet, based on a system that he uses for his own Excel reports.
Tip: In the sample file for this technique, there are only three sheets with pivot tables. You could expand the dashboard summary, to include reports for many more sheets.
Pivot Tables and Slicers
AlexJ sends out several monthly reports that are pivot tables, all based on the same source data.
- Each pivot table is on a separate sheet
- Each pivot table has a unique layout and filters
- Each pivot table has one or more Pivot Table Slicers
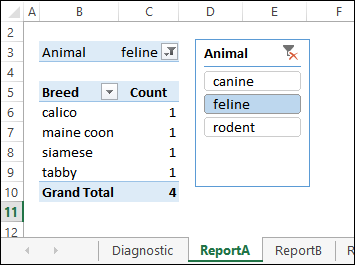
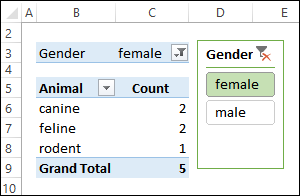
In the screen shot below you can see Report A, and its filter and Slicer for the Animal field.
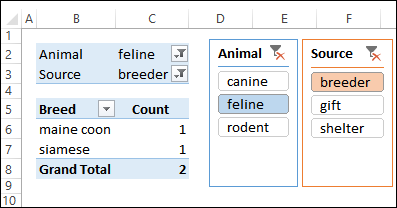
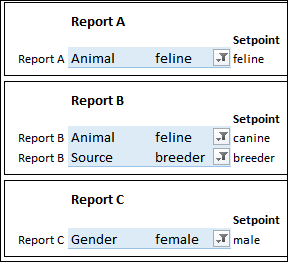
Report B is slightly different and has 2 Slicers – Animal and Source.
The final report – Report C – has one Slicer, and different fields in the pivot table layout
Record the Filter Setpoints
To make sure that the monthly reports are standardized, AlexJ needs specific items selected in each filter, for each pivot table.
AlexJ listed each report’s filter settings on the Dashboard, in the Setpoints section.
For each filter, the Setpoint list shows:
- Report name
- Filter pivot field name
- Current selection in that filter
- Setpoint item for that filter
Tiny Pivot Tables
And here’s the special trick that AlexJ uses, to manage all the individual pivot table filters – the blue cells on the Diagnostic Dashboard are tiny pivot tables!
Each tiny pivot table is:
- a copy of its main pivot table report
- connected to the same Slicer as the main pivot table’s filter
Formulas Show Mismatched Setpoints
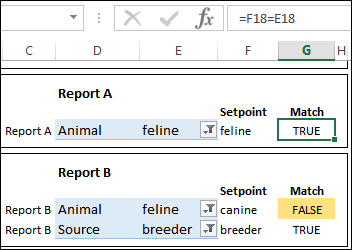
With the tiny pivot tables in place, formulas on the dashboard compare the
- selected item in the tiny pivot table
- and the item in Setpoint column
Total Count for Reports
Other formulas count up the mismatches, to give a total count of ready reports, and reports that need to be fixed.
The formula in cell F5 shows how many reports are ready to publish. It counts the TRUE results, and uses a structured reference to the Ready column
- =COUNTIF(tblPrint[Ready],TRUE)
The formula in cell F7 counts the FALSE results, to return a count of the reports that need to be fixed.
- =COUNTIF(tblPrint[Ready],FALSE)
Get the Dashboard Workbook
To see the details for setting up this pivot table reporting dashboard, and to get the completed workbook, go to the Excel Report Diagnostic Display page on my Contextures site.
The zipped Excel workbook is in xlsx format, and does not contain macros.
Also, you can see more Excel Sample Files by AlexJ on my Contextures site.
Video: Add Slicers to Pivot Table
In this video you can see the steps for adding a slicer to a pivot table, and then using slicers to filter the data. The written instructions are on the Pivot Table Slicers page.
______________________________
Excel Dashboard Check Pivot Table Filters Before Printing
______________________________

