After you set up a pivot table, you might want to prevent other people from making changes to the way that it is set up. With a bit of programming, you can restrict what happens to a pivot table.
Show Survey Responses in Pivot Chart
I’ve updated one of the pivot chart sample files on my Contextures website. On the main sheet, there are two pivot charts, showing survey responses by department, and by years of service.
At the top of the sheet, you can select a question from the dropdown list, and view the survey results for that question.
Scroll Through Report Filter Items
In Excel 2010, slicers were added to Excel, and they make it easy to select one or more items in a pivot table’s Report Filter.

Running Total Stops at Year End
A quick way to show how amounts accumulate over time is to build a pivot table, and show the values as a running total.
However, if you group the dates by year and month, the running total stops at the end of each year, and starts again at the start of the next year. There is no setting you can adjust to change this behavior.
Create a Pivot Table in Excel 2013
There is a new feature in Excel 2013, that makes it even easier to get started with pivot tables.
Just select a cell in your source data table, and on the Ribbon’s Insert tab, click Recommended PivotTables.
Show and Hide Pivot Table Details
In a pivot table, you can show all the summarized data, or focus on specific details. One way to hide information is with filtering, and that affects the pivot table totals.
Show Percent of Subtotal in Pivot Table
A pivot table is a great way to summarize data in Excel, and you can show sums, counts, averages, and other functions.

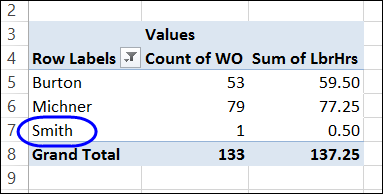
Group and Ungroup Text Items in Pivot Table
The Grouping dialog box isn’t available if you try to group items in a text field. Instead, you can manually group the items.
- Select the all of the items that you want to group
- Right-click on one of the selected items, and click Group

Continue reading “Group and Ungroup Text Items in Pivot Table”
Block New Pivot Items in Filtered Field
When you click on the arrow in a pivot table heading, you can manually filter the field’s items, by adding and removing check marks from the list of pivot items. That lets you focus the report on specific items, and temporarily ignore the other data.
How to Adjust the Pivot Table Field List
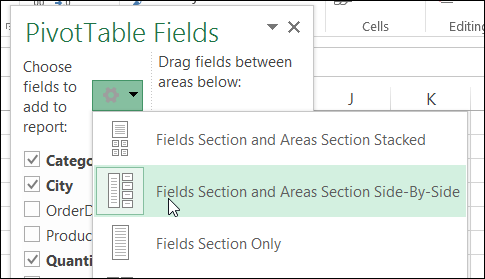
When you create a pivot table, and select a cell in it, by default, a pivot table field list should appear, at the right of the Excel window.
