When a pivot table has grand totals, Excel automatically names those totals. I’ll show you some examples, with details on which grand total headings you can change, and which ones you can’t.
Category: Group and Total
Grouping Dates Add Extra Items in Pivot Table Filter
Last week, someone asked me how they could get rid of the extra items that appear in the filter, when you group a date field. Maybe you’ve seen them too – they start with a less than or greater than symbol, and show the first and last dates in your pivot table data.
You can see an example in the screen shot below.
Continue reading “Grouping Dates Add Extra Items in Pivot Table Filter”
Show Running Total in Excel Pivot Table
With a running total in a pivot table, you can see how amounts accumulate over a period of time, or through another field, such as products, or customers.
In the screen shot below, the Quantity field shows a running total across the Months column. In March, the Year To Date total for Corner Cabin is 2595.

Excel Meal Planner With Pivot Table
Now that fall is here, you might be back into a routine of weekly meal planning, and Excel is a great tool to use for that.
To help you get started, there is a weekly meal planner on my Contextures website, that you can download. Enter the meal and product information, based on your favourite meals.
Then, pick your meals for the upcoming week, and click a button to create a weekly shopping list.
Group By Periods in Excel Pivot Table
If you’re working with dates in a pivot table, it’s easy to group them by years, months or days – those are options in the Group By dialog box.
However, sometimes you might need a different type of date grouping. In this example, we’d like to group the sales data into 4-week periods, to match our company’s sales calendar. Keep reading to see the steps to set that up, and make sure the period starts on the correct weekday.
Grouping Shows Items Before and After Date Range
When you group a date field, Excel automatically creates creates groups for all the dates before the start date and after the end date. These items start with a “<” or a “>” symbol, such as “<2012-01-01” and “>2013-12-31”
Usually, you will only see these dates in the filter drop downs.

Continue reading “Grouping Shows Items Before and After Date Range”
Find MIN IF and MAX IF From Excel Pivot Table
In Excel, you can use array formulas to find MIN IF and MAX IF. For example:
- What was the lowest total order price for the Carrot Bars product?
- What was the highest price for that product?
Continue reading “Find MIN IF and MAX IF From Excel Pivot Table”
Prevent Subtotals from Appearing
If you add more than one field to the Rows or Columns area in a pivot table, some of the fields automatically get subtotals. In the screen shot below:
- the City field has a subtotal, because it is an outer field – there is at least one field after it in the layout. Outer fields get subtotals by default.
- the Category field does not have a subtotal, because it is an inner field – there is no field after it in the layout. The innermost field in the Rows or Columns area doesn’t get a subtotal.
Group and Ungroup Text Items in Pivot Table
The Grouping dialog box isn’t available if you try to group items in a text field. Instead, you can manually group the items.
- Select the all of the items that you want to group
- Right-click on one of the selected items, and click Group

Continue reading “Group and Ungroup Text Items in Pivot Table”
GetPivotData Problems With Subtotals
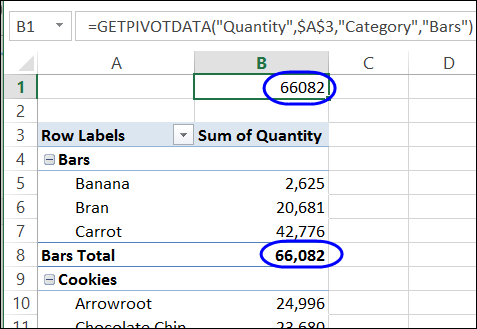
To pull data from a cell in a pivot table, you can use a normal cell reference, such as =B5, or you can use the GetPivotData function, which is specially designed to extract data from a pivot table.