A pivot table makes it easy to summarize a large amount of data, to see how your business is doing. But big numbers are hard to analyze at a quick glance. To make things clearer, you can show rank in an Excel pivot table, as well as the large numbers.
Food Product Sales
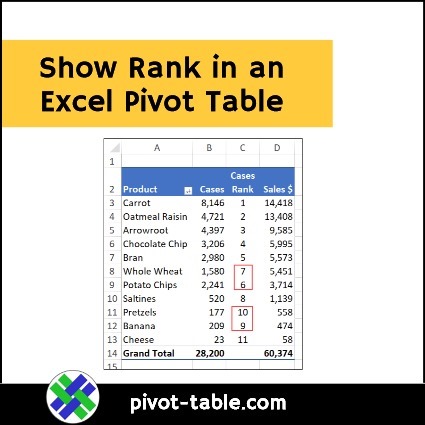
In this example, there’s a pivot table with food product sales. It shows the number of cases sold for each product, and the product sales dollars.

Show Rank for Easy Comparison
To make it easier to compare the products, I’ll show how to make two changes to the pivot table:
- sort by sales dollars, largest to smallest
- rank the sales dollars for each product

Video: Show Rank in Pivot Table
To see the steps for sorting the sales dollars, and showing their rank, in this pivot table, you can watch this short video. There are written instructions below the video.
Sorted by Product
With the pivot table sorted by product name, you can easily see that Carrot and Oatmeal Raisin have high numbers for Sales $, and Cheese has a very low number.
However, it takes a bit of effort to see how the rest of the products did, in relation to the others. For example, which product had the 4th highest sales dollars?
Sort by Sales $ Amounts
To make it easier to see which products have the highest and lowest sales, you can sort by the Sales $ column:
- Right-click on any number in the Sales $ column
- Point to the Sort command
- Click on Sort Largest to Smallest

After the products are sorted by the Sales $ amounts, it’s easy to see which products have the highest revenue, and which ones had the lowest sales.

Compare to Cases Sold
The pivot table also shows the number of cases sold for each product. Are those numbers in the same order as the Sales $ amounts?
If you check carefully, there are a couple of places where the case numbers are in a slightly different order from the sales dollars order.
- Whole Wheat sold fewer cases than Potato Chips, but had higher Sales $
- Pretzels sold fewer cases than Banana, but had higher Sales $

Add Column for Rank
To make it easier to spot any differences in the order, you can add another column to the pivot table, and show the Rank, based on the number of cases sold.
- First, in the PivotTable Field List, right-click on the Quantity field
- Click on “Add to Values”

A new field – Sum of Quantity – is added to the Values area in the pivot table, to the right of the Sales $ field.
The new column shows the same numbers as the Cases column.

Change Column Heading
This new field will show the rank, so change its heading to “Rank”

Change the Calculation
The next step is to change a setting for the new column, so it shows the Rank, instead of the total number of cases sold.
- First, right-click on any number in the Rank column
- In the pop-up menu, point to the Show Values As command
- Click on Rank Largest to Smallest

Choose a Base Field
Next, a small window appears, asking you to select a Base Field for the calculation.
- In the Base Field box, click the drop-down arrow, to see the choices
- There only one Row field (Product) in this pivot table
- Product is the only choice you’ll see in the drop down list
- Click on the Product field
- Next, click the OK button, to apply the Rank custom calculation.

Check the Rank Column
In the revised pivot table, it is much easier to spot any differences in the order of Cases versus Sales $.
- It’s easier process small numbers, like 1 to 10, in our heads
- We can see that the ranking is different for some products:
- 7 comes before 6
- 10 comes before 9

(Optional) Move the Rank Field
Because the Rank field is based on the number of Cases, I moved it to the left, so it’s between the Cases and Sales $ fields.
To move the Rank field:
- First, click on the heading cell for the Rank column
- Point to the bottom border of the selected cell
- Drag the cell to the left of the Sales $ cell
- You’ll see a thick line as you drag, showing where the column will move to

The Completed Pivot Table
In the completed pivot table, you can quickly :
- see the Cases and their Rank
- compare case ranking to the sorted values in the Sales $ column.
Now it’s much easier to see the discrepancies in the Rank column, instead of mentally comparing the bigger numbers in the Cases column.
Get the Sample File
To get the completed sample file for this example, and to see examples for other custom calculations, go to the Pivot Table Show Values As page of my Contextures website.
The zipped Excel file is in xlsx format, and does not contain macros.
__________________
How to Show Rank in an Excel Pivot Table


_________________
One thought on “How to Show Rank in an Excel Pivot Table”