A pivot table is a quick and effective way to summarize data, and you can also create a pivot chart, to show a visual summary. And, if you’re summarizing the data by date, you’ll usually need to group the date field, to get a chart that’s easy to read.
This short video shows the steps, and there are written instructions below the video.
Compare Years in Pivot Chart
In this example, the source data contains records from the service department at a manufacturing company. The pivot table counts the number of work orders that were completed each day. We’ll build a chart that compares last year’s monthly counts to this year’s.
Create a Pivot Chart
If you create a chart from the pivot table, when all the dates are listed, it’s impossible to see the details.

You can see a few dates that have higher numbers than the others, but you can’t see monthly totals, or compare years.
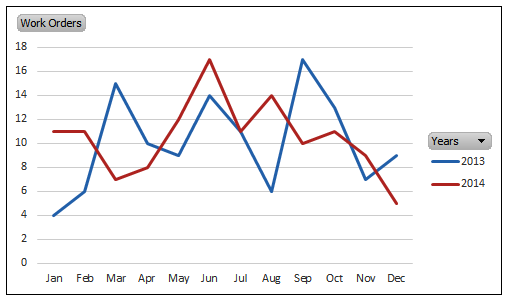
Change the Chart to Compare Years
To compare the monthly totals, year over year, you’ll need to group the date field in the pivot field, by Years and Months.

Follow these steps to group the dates and create a line for each year:
- In the pivot table, right-click a cell in the date field, and then in the popup menu, click Group.
- In the Grouping dialog box, select Years and Months, and click OK.
- In the PivotTable Field List, move the Years field to the Column Labels area.
The pivot chart layout will change, and each year will each be represented by a separate line.
Download the Sample File
To download the sample file, please visit my Contextures website. On the Sample Files page, go to the Pivot Tables section and look for PT0037 – Compare Years in Pivot Chart. The file is in xlsx format, and does not contain macros.
Also, see how to compare sales year over year, by weekday, instead of calendar date. Add formulas and a pivot table, to compare weekdays in any fiscal week.
Video: Compare Years in Pivot Chart
To see the steps for grouping the date field, and comparing years in the pivot chart, please watch this short video tutorial.
________________________
Thank you, just what I was looking for!
Great! I just didn’t noticed that grouping separates date parts to different fields.
Though if you analyse real data, you will notice, that unaligned weekdays (monday, tuesday, etc) could make your comparison unusable.
Hi,
Thank you for this tutorial.
I have very similar set of data (customer visits) and I have done everything the same but for some reason the later year (2019 in my case) is actually a total value of both 2018 and 2019 data. What might be the issue?
I’m working in Excel 2016.
Many thanks and BR,
Hrvoje