In the PivotTable Field List, the fields usually appear in the same order that they appear in the source data. If the pivot table source data has lots of fields, it might be hard to find a specific field in the list.

To make it easier to find the fields in the long list, you would like the field list in alphabetical order.
Sort the List
You can change a pivot table option, to make the PivotTable Field List show the fields in alphabetical order.
- Right-click a cell in the pivot table, and in the pop-up menu, click PivotTable Options.
- In the PivotTable Options dialog box, click the Display tab.
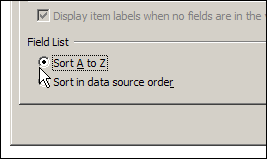
- At the bottom of the Display tab, in the Field List section, select Sort A to Z, and then click OK

Later, if you want to return the field list to its original order, select Sort in Data Source Order, instead of Sort A to Z.
_______________

Hi,
I’m trying to sort the field list as in the data source; unfortunately, the two field list options (under display tab in the pivottable options menu) are no accessible … both are greyed out.
Any suggestions?
thx
Gabriel
Gabriel, if the pivot table is based on an OLAP source, those options aren’t available. Could that be the problem?
Hi Debra,
thanks a lot for your reply. As a matter of fact, my pivot table is based on an OLAP source. As far as you know, is there a way to sort the dimensions (not its elements) in a different way rather than the default one (alphabetically)?
Thanks a lot.
Gabriel
Hi Gabriel,
As far as I know, there’s no way around the sorting limitation for the OLAP source field list.
If you can change the OLAP source, you could number the field names, in the order you want them to appear, e.g. 01_Country
Debra
Once again, hi 🙂
I tried that solution. In fact, it orders the dimensions in the way I want and also solves a problem (I think a bug) that I’m encountering; you can find the description of it in this two forums:
– http://social.msdn.microsoft.com/Forums/en-US/sqlanalysisservices/thread/721ca4f8-8ac4-44d7-9672-05144c92ff4f
– https://connect.microsoft.com/SQLServer/feedback/details/638043/olap-cube-translations-collapses-folders-in-excel-pivottable-field-list#details
Numbering the dimensions solves the problem in Excel, but, if you browse the cube with another software (ie. ProClarity), not all members of each dimension are grouped within its dimension (I guess it’s not so clear what I’m trying to say; I’ll try with an example):
Dim Date [Hierarchy Year, Hierarchy Quarter, Hierarchy Month, Day]
Dim Shift [Operator]
Since Dim Date contains hierarchies, ProClarity groups them within the Date group; instead, since Dim Shift contains only Operator member, ProClarity displays it without grouping it by Shift … So if i number 1. Date, 2. Shift … The result in ProClarity would be:
1. Date
…
…
Operator
The number 2 is lost. If perhaps a 3rd dimension exists (and contains hierarchies, or more than one member), the result would be:
1. Date
…
…
Operator
3. Dim Name
Hope it’s clear 🙂
I hope you can give a look to the aforementioned links, maybe you have faced the same problem.
Thanks a lot for your replies Debra.
Have a nice day!
Gabriel
1. Date
…
…
Operator
3. Dim Name
So the number 2 goes lost.
Hope it’s clear 🙂
I hope you can give a look to the aforementioned links, maybe you have faced the same problem.
Thanks a lot for your replies Debra.
Have a nice day!
Gabriel
Can you sort the field list in excel 2003?
Thank you Sir, Thank you very much… I was facing very difficult, while creating pivot table report. This will help me a lot….
Thanks for the tip on sorting pivot table field list
Is there a way to make this setting a permanent one vs. having to always adjust.