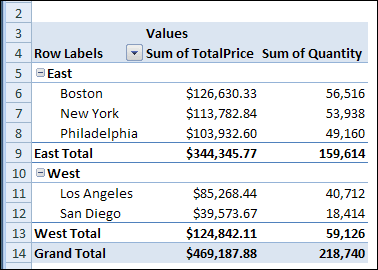
When you add multiple fields to the Row Labels area in a pivot table, subtotals automatically appear for the outer fields. In the pivot table shown below, Region and City fields are in the Row Labels area. Two fields are in the Values area: Sum of Quantity shows the total quantity for each city, and Sum of TotalPrice shows the total sales amount.

Region Subtotal is Shown
A subtotal row is at the bottom of each region. It shows the total quantity and total sales for each region. You can add another row of subtotals for each region, to show the average quantity and sales.
Add More Subtotals
You can change the field settings for the Region field and it will show more subtotal rows:
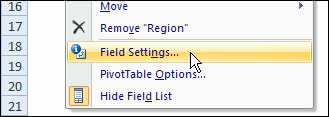
- Right-click one of the Region row labels, and click Field Settings.

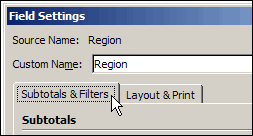
- In the Field Settings dialog box, click the Subtotals & Filters tab.

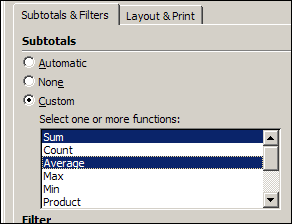
- In the Subtotals section, click Custom. Note: When you select Custom, the Automatic subtotal is removed.
- In the list of functions, click Sum and Average – the functions you want to use as subtotals.

- Click OK, to close the Field Settings dialog box
Note: When you select multiple Custom subtotals, the subtotals are displayed at the bottom of the group, even if you set the option to show subtotals at the top of the group.
_________________

Why whe I select Sum and Average my Sum looks right but the average below is not correct for each subtotal of the groups?