Count Unique Items in Pivot Table With Excel 2013 PowerPivot

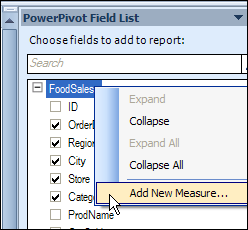
Last year, I described how to create a unique count in an Excel 2010 pivot table, by using the PowerPivot add-in. In that version, you can right-click on the table name in the field list, to add a new measure.

countdistinct00a

Continue reading “Count Unique Items in Pivot Table With Excel 2013 PowerPivot”

Unique Count in Pivot Table With Excel PowerPivot

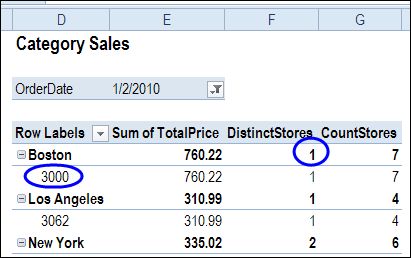
In Excel 2010, there is no built-in summary function that calculates a distinct count or unique count in a pivot table. In the pivot table shown below, we’d like to see the number of stores in Boston, where each product category was sold.

Continue reading “Unique Count in Pivot Table With Excel PowerPivot”

Special Price Today on Microsoft PowerPivot Ebook

If you’re interested in learning how to use Microsoft PowerPivot for Excel 2010, here is a bargain for you.

There’s a special price today on the ebook version of Microsoft PowerPivot for Excel 2010: Give Your Data Meaning, by Mark Russo and Alberto Ferrari.

Here’s the tweet that announced the special price:

#Ebook Deal of the Day: Microsoft PowerPivot for Excel 2010 – $14.99 (Save 46%) Code DDPVT

The link in that tweet takes you to the O’Reilly page, where it shows the full price. Just click the “Add to Cart” button for the Ebook version, and enter the special code (DDPVT).

Newer Version

Update: There is a newer version of this book available now — Microsoft Excel 2013 Building Data Models with PowerPivot

___________

PowerPivot Contest

powerpivoticon If you love the new PowerPivot add-in for Excel 2010, you can enter the latest contest on the PowerPivotPro blog. Show off your efficient PowerPivot techniques, and win one of the two top prizes — a 1 year MSDN subscription.

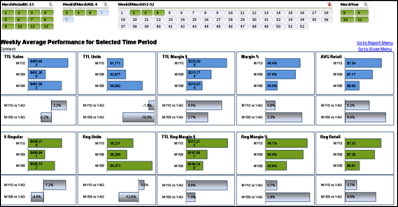
Send in your sample workbooks, with charts and slicers and cross-filtering enabled. Impress Rob with your PowerPivot skills, and you might win one of the top prizes, or a PowerPivot poster.

Here’s how Rob will decide the winner:

Entries will be judged on, in roughly descending order:

  1. Performance – I will compare query speed with slicer cross-filtering turned on vs. turned off.  Smaller differences are better for this contest.
  2. Polish – as I slice the report, do the charts all still look nice?  Ex:  Blank space in charts = not good.
  3. Ease – how hard is it to execute your technique?  We will turn winning entries into blog posts, and this will become a new reference technique here at PowerPivotPro.
  4. Originality – this never hurts but is not crucial.  Fun is good.  Unexpected benefits and features are even better.

I don’t see a closing date for the contest, so you’d better get started soon, and send in your entry ASAP.

Update: Contest closes Sunday October 3rd, 11:59 PM US Pacific time
dashboardsheet_thumb

___________

PowerPivot For Excel 2010

Microsoft PowerPivot for Excel 2010 is a data analysis add-in for Excel 2010, and is part of the Office 2010 Beta. You can test PowerPivot in the hands-on Virtual Lab, or in the Office 2010 Beta, if you’ve downloaded that.

That’s where I tested PowerPivot last weekend, and described the experience in my Contextures blog article, Drill Into Data With PowerPivot.

There are step-by-step instructions in the module, and you can experiment a bit on your own too. For example, I tried a few of the Slicer  formatting features.

PPivotLab_02

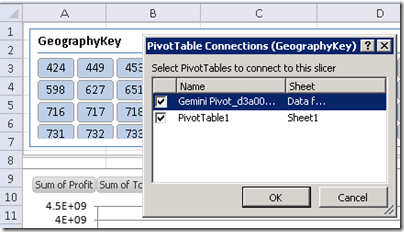
You can connect each slicer to one or more of the pivot tables, and filter all the connected pivot tables at the same time.

PPivotLab_01

_______________

___________________