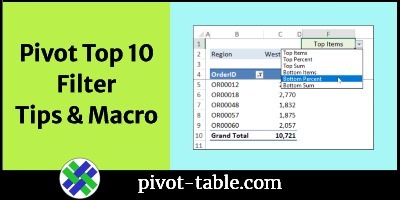
The Pivot Table Top 10 Filter feature lets you focus on what’s working well. Create a report that shows sales from the top regions, or show the best-selling products. You can use this feature to show the opposite too. Which products are selling poorly? Which cities or regions aren’t doing well? These two short videos show quick ways to analyse sales data with pivot table top 10 filters.
Video: Using Pivot Table Top 10 Filters
Use the Top 10 filter feature in an Excel pivot table, to see the Top or Bottom Items, or find items that make up a specific Percent or items that total a set Sum.
For example, filter to see only your best-selling products, instead of the full list. Or, change the filter to show the bottom items. Which products need extra attention, to help improve their sales?
For the written steps, go to the Pivot Table Top 10 Filters page on my Contextures site.
Video: Compare Top and Bottom Product Sales
In this video, a pivot table summarizes the products sales over a two year period. With a Top 10 Filter, you can quickly show the top products.
Or, set up side-by-side pivot tables, and compare your top-selling and bottom-selling products, with just a few clicks – no formulas needed.
Pivot Table Top 10 Filter Macro
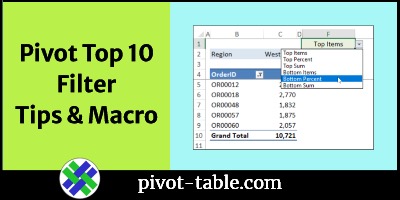
To make it easier to apply Top 10 filters to your pivot tables, use a macro, instead of using the Top 10 Filter dialog box.
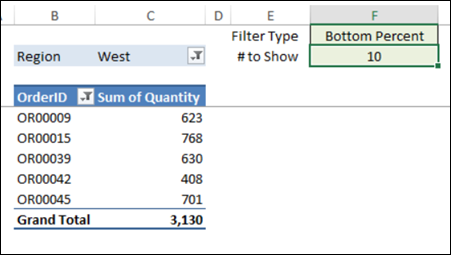
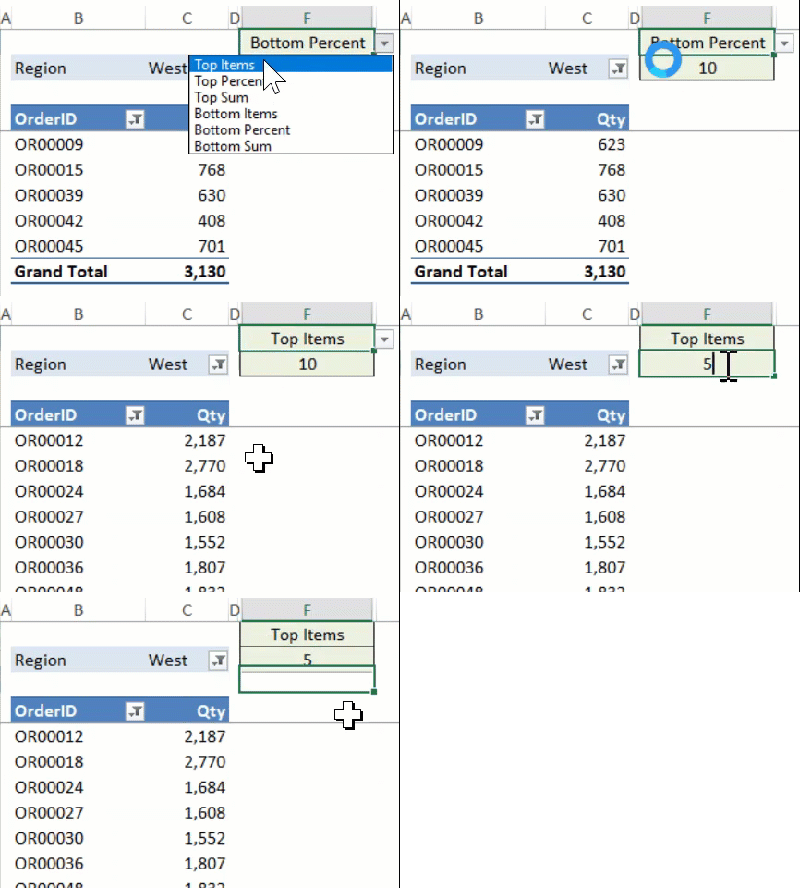
- Choose a filter type from the drop down in cell F1
- Type a number in cell F2
The macro runs automatically when those cells are changed, to apply the new settings for the Top 10 filter.
If there are multiple pivot tables on the worksheet, the macro will change the Top 10 filter settings for all of them. That’s much quicker than manually changing each pivot table’s filters.
You can get the code and setup instructions on my Contextures site, and download a sample file with the macro and pivot tables for testing.
More Pivot Table Top 10 Filter Info
For written steps on using the Top 10 filter, go to the Pivot Table Top 10 Filters page on my Contextures site.
The sample file is in xlsm format, and contains pivot tables for testing, as well as the macros to update the Top 10 filters from the worksheet values.
________________
How to Use Pivot Table Top 10 Filters to Analyse Sales Data
________________

